UI Guide
This guide walks through the main dashboard and admin flows.
Dashboard
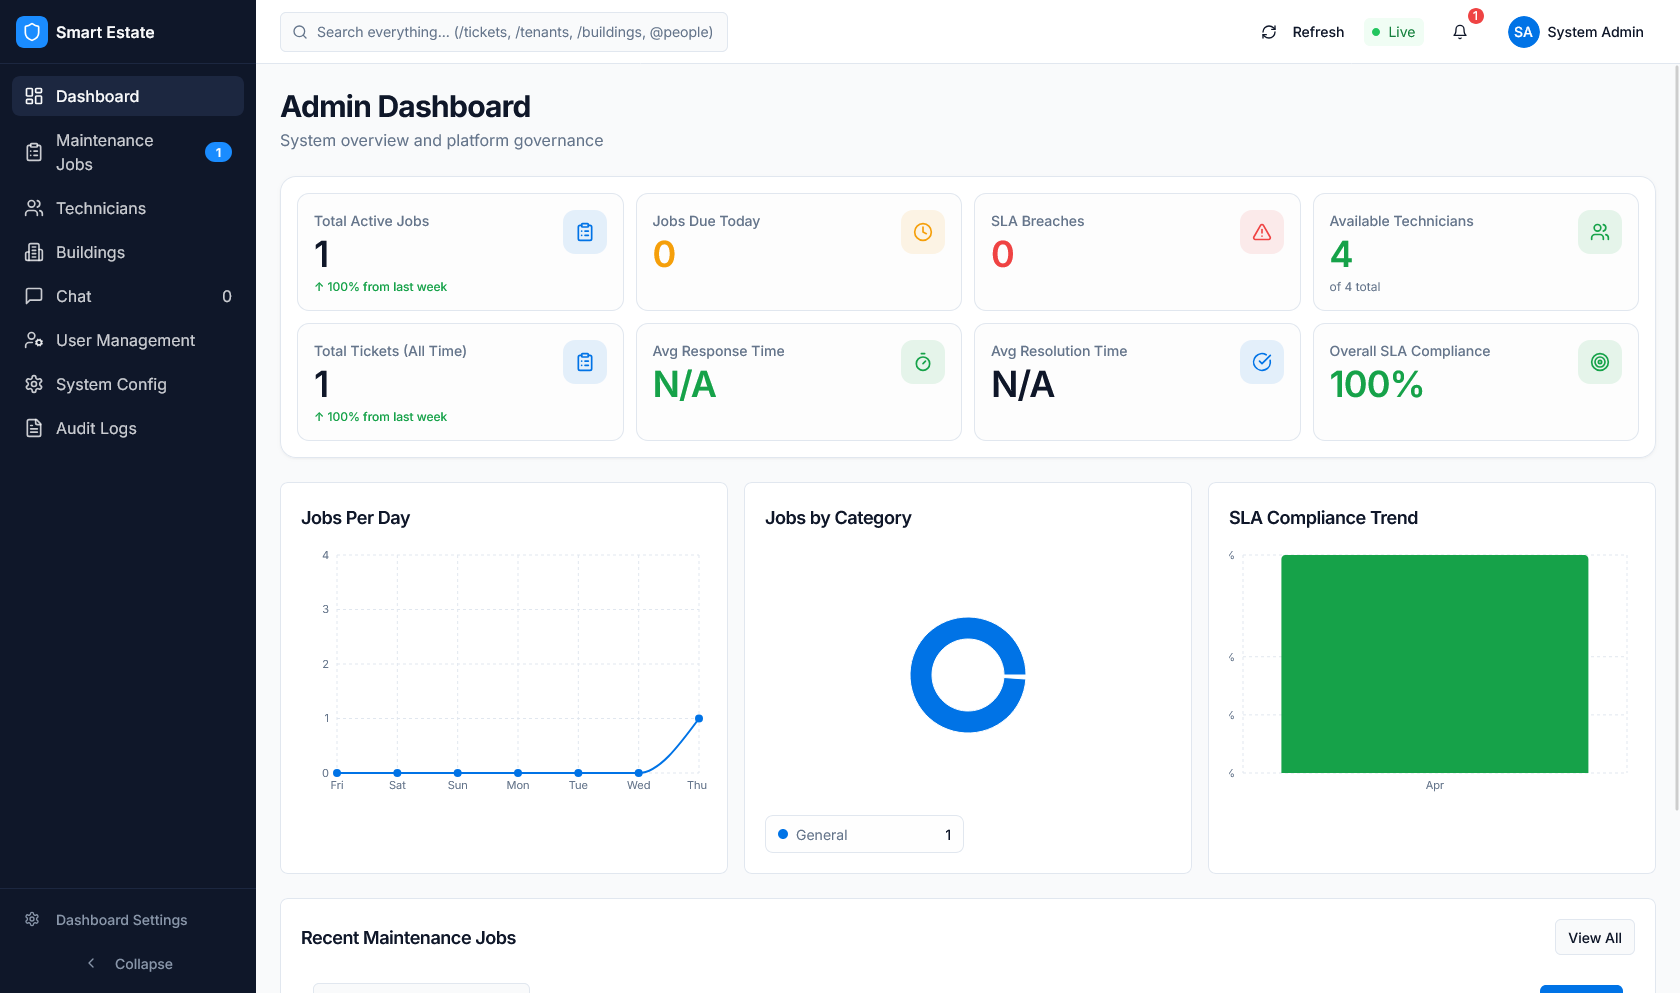 Caption: Main dashboard with KPI cards, charts, and recent jobs.
- What it does: gives a live view of workload, SLA health, and recent activity.
- What users can do: scan metrics, spot breaches, and open the latest work.
- What data is shown: ticket counts, compliance, trends, and recent jobs.
Tickets / Jobs
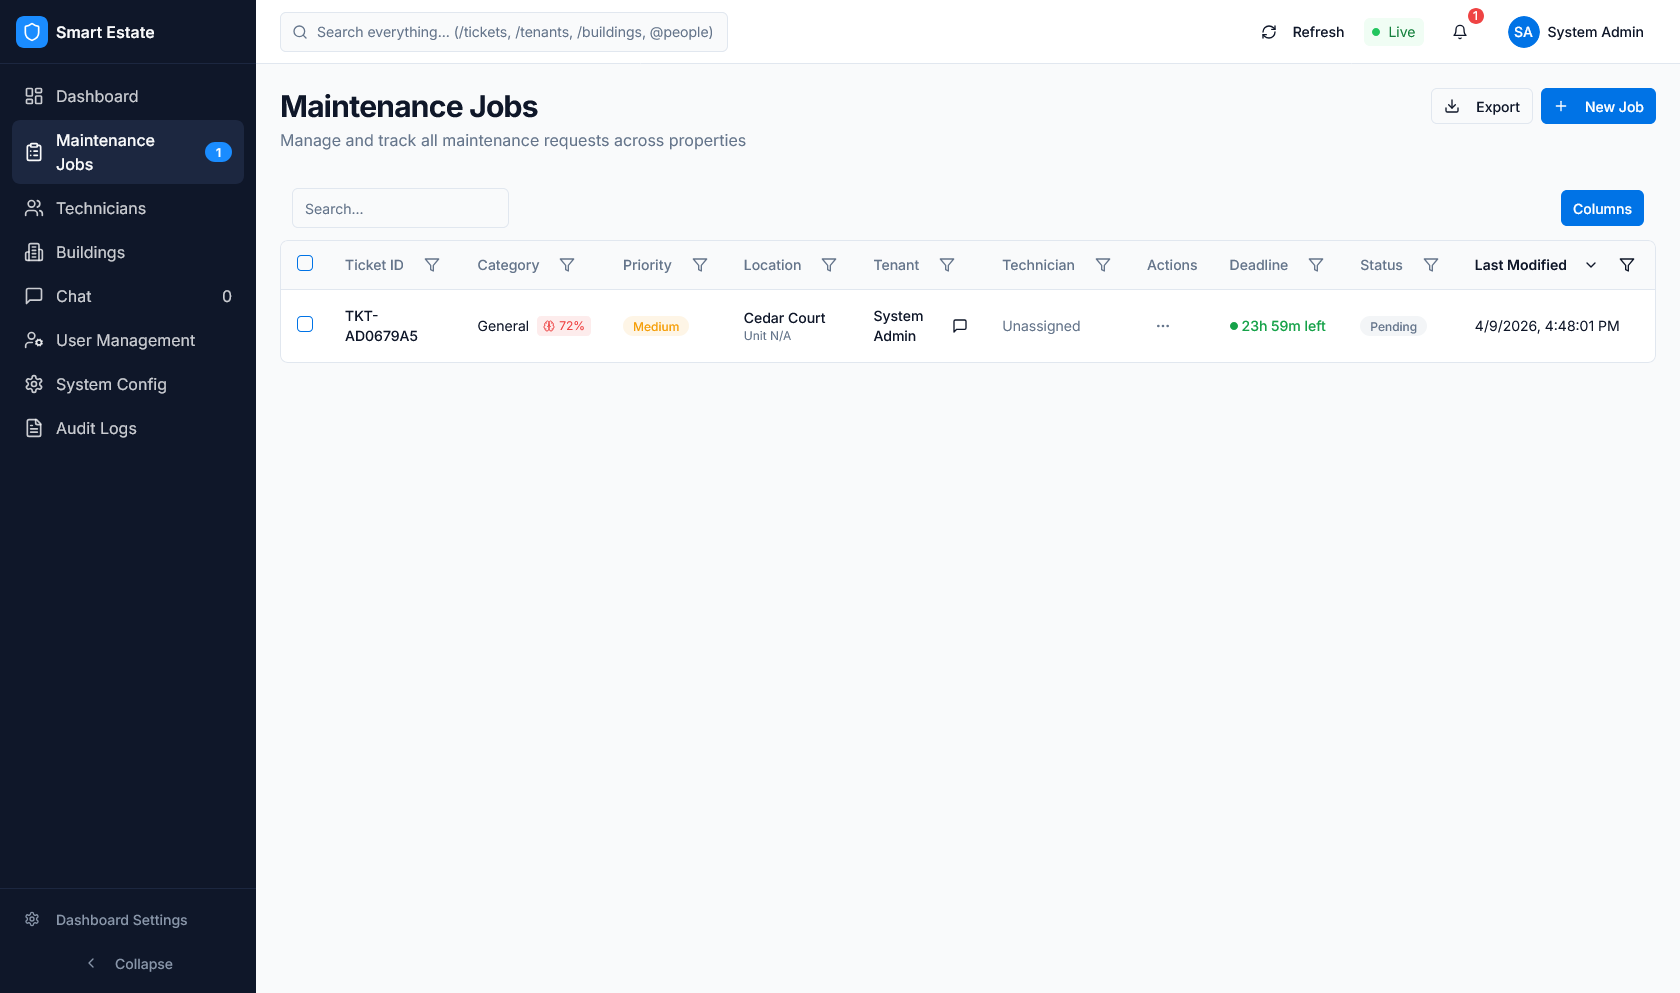 Caption: Maintenance jobs table with status, SLA, and assignment columns.
- What it does: lists every ticket the user can access.
- What users can do: filter, sort, open, edit, export, and track status.
- What data is shown: title, tenant, priority, SLA state, technician, and timestamps.
Technicians
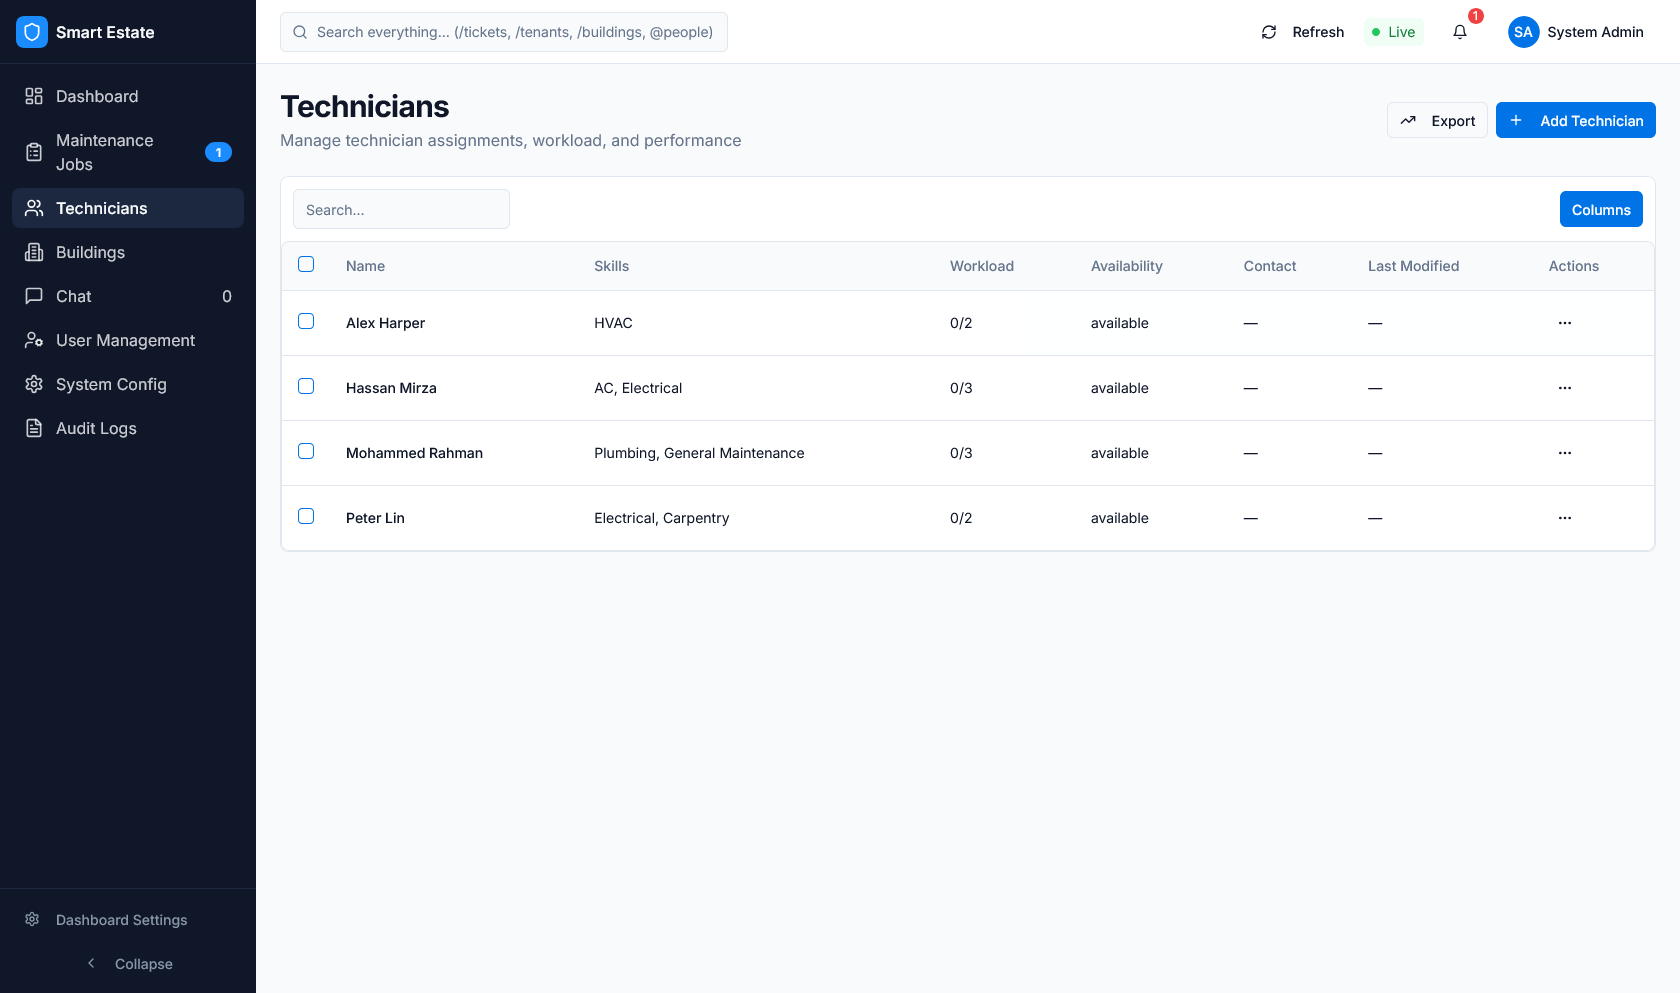 Caption: Technician list with workload, skills, and availability.
- What it does: shows the dispatch pool for operations users.
- What users can do: add technicians, review profiles, assign work, or update status.
- What data is shown: skills, location, load, availability, and contact actions.
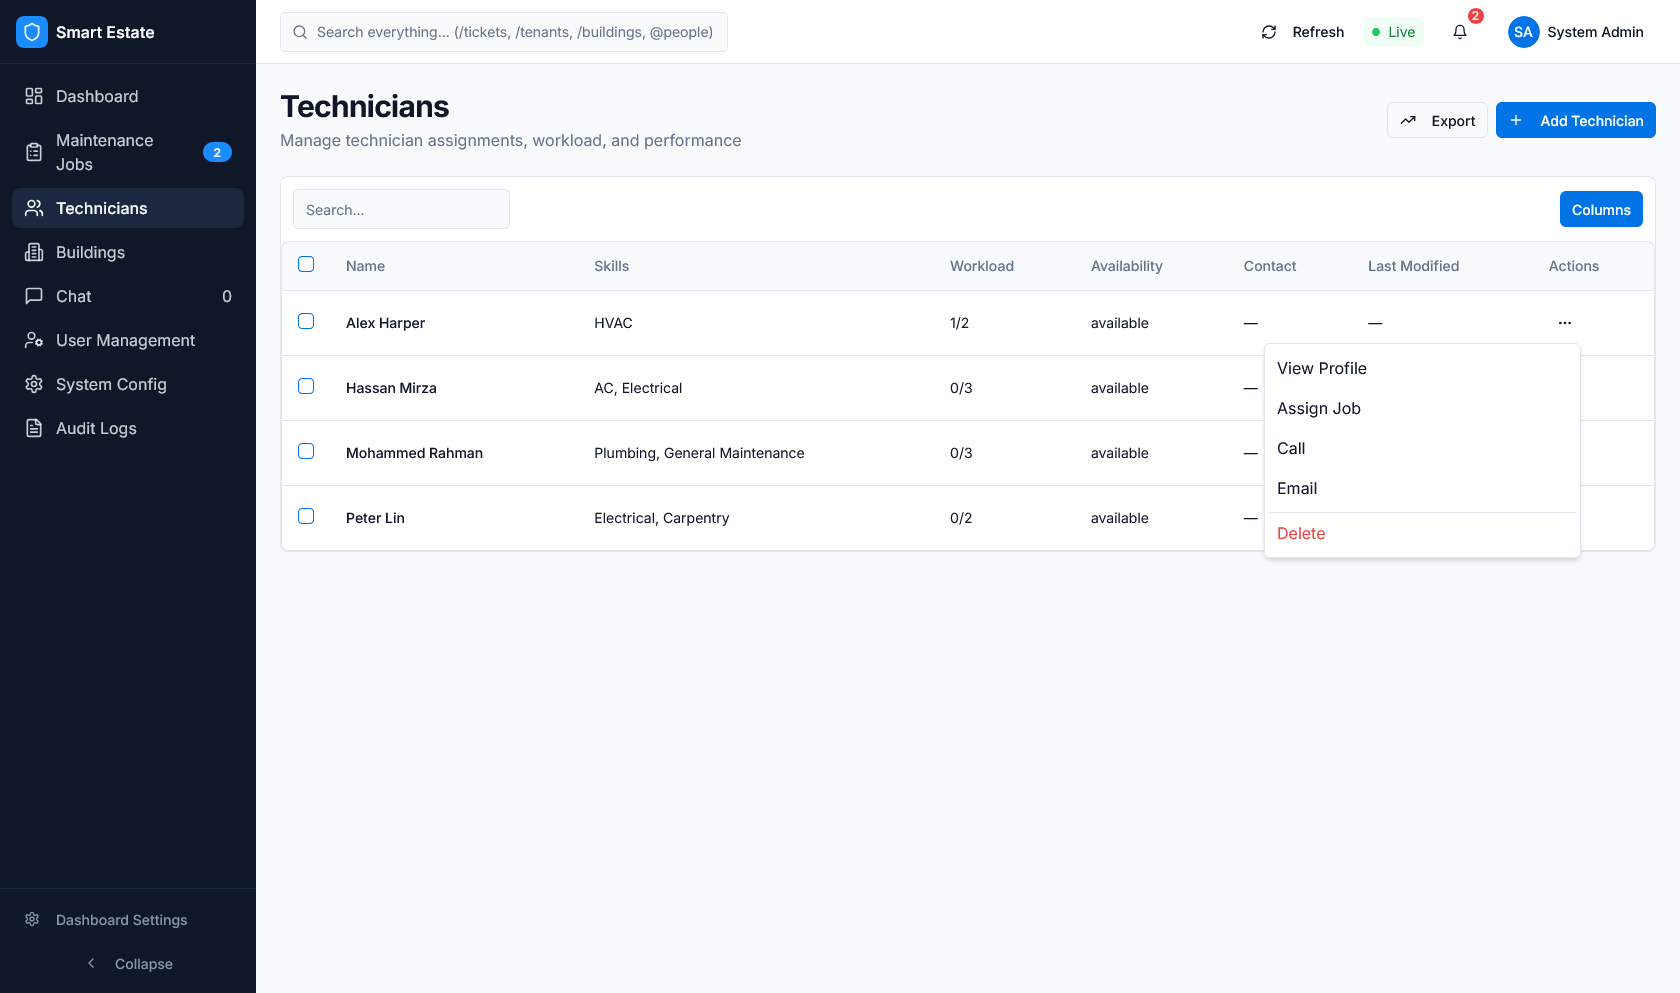 Caption: Row actions for technician management.
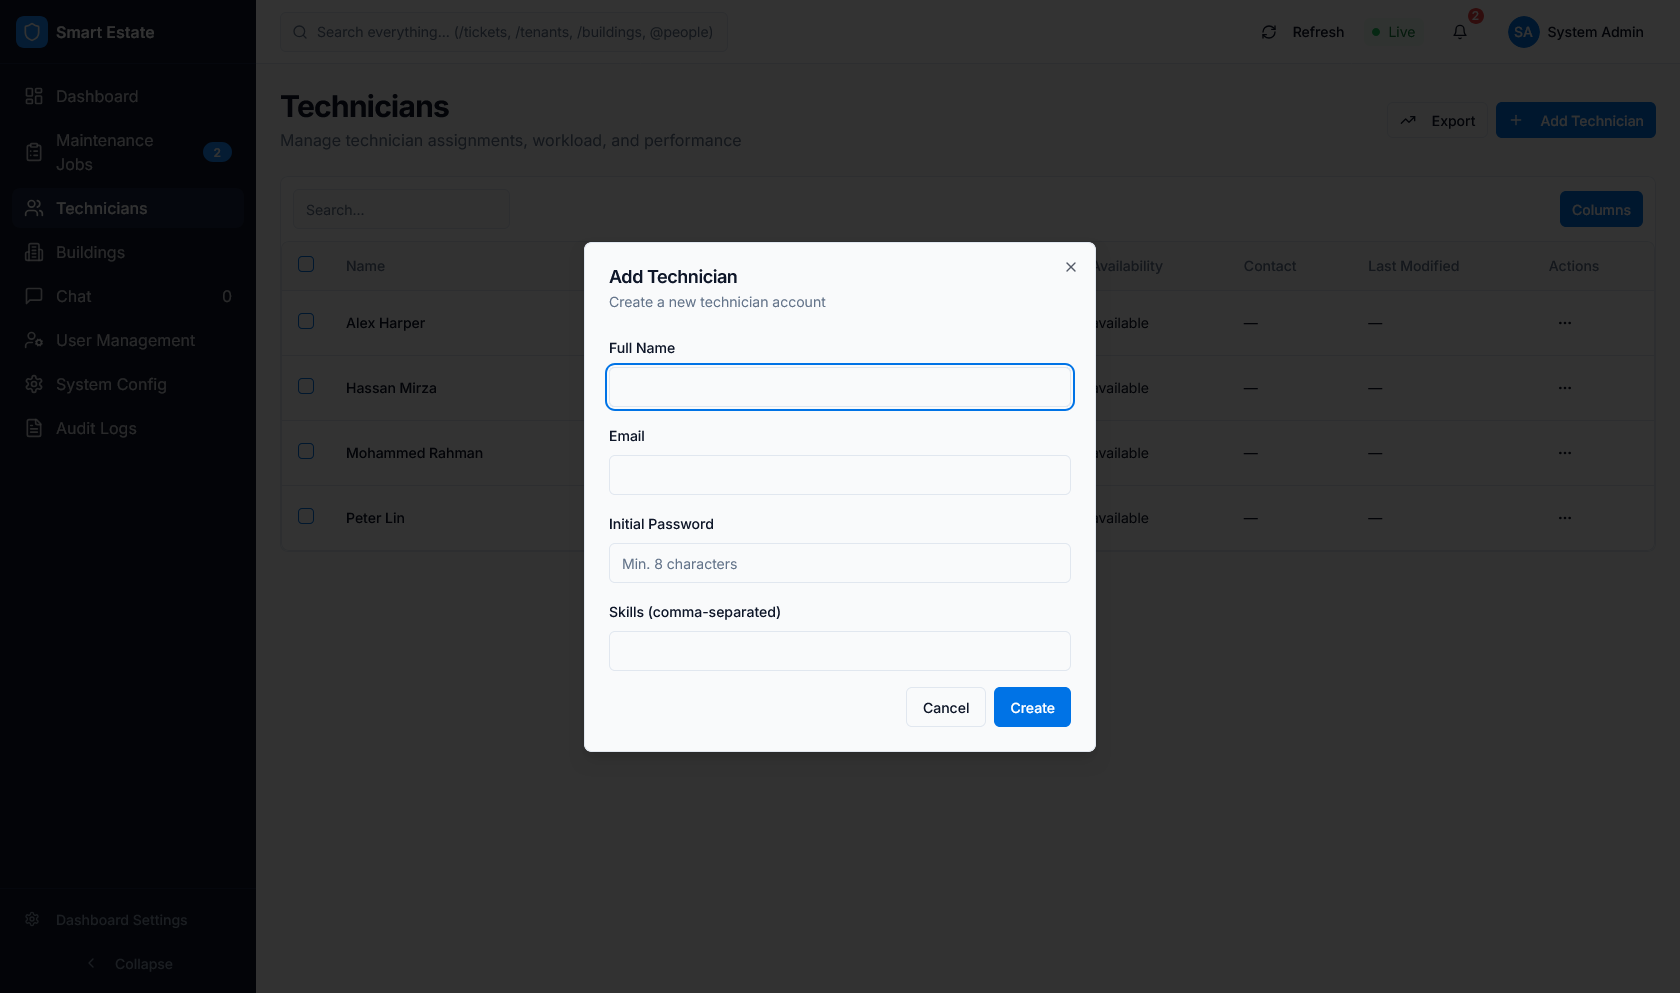 Caption: Technician creation form used to register dispatch-ready staff.
Buildings
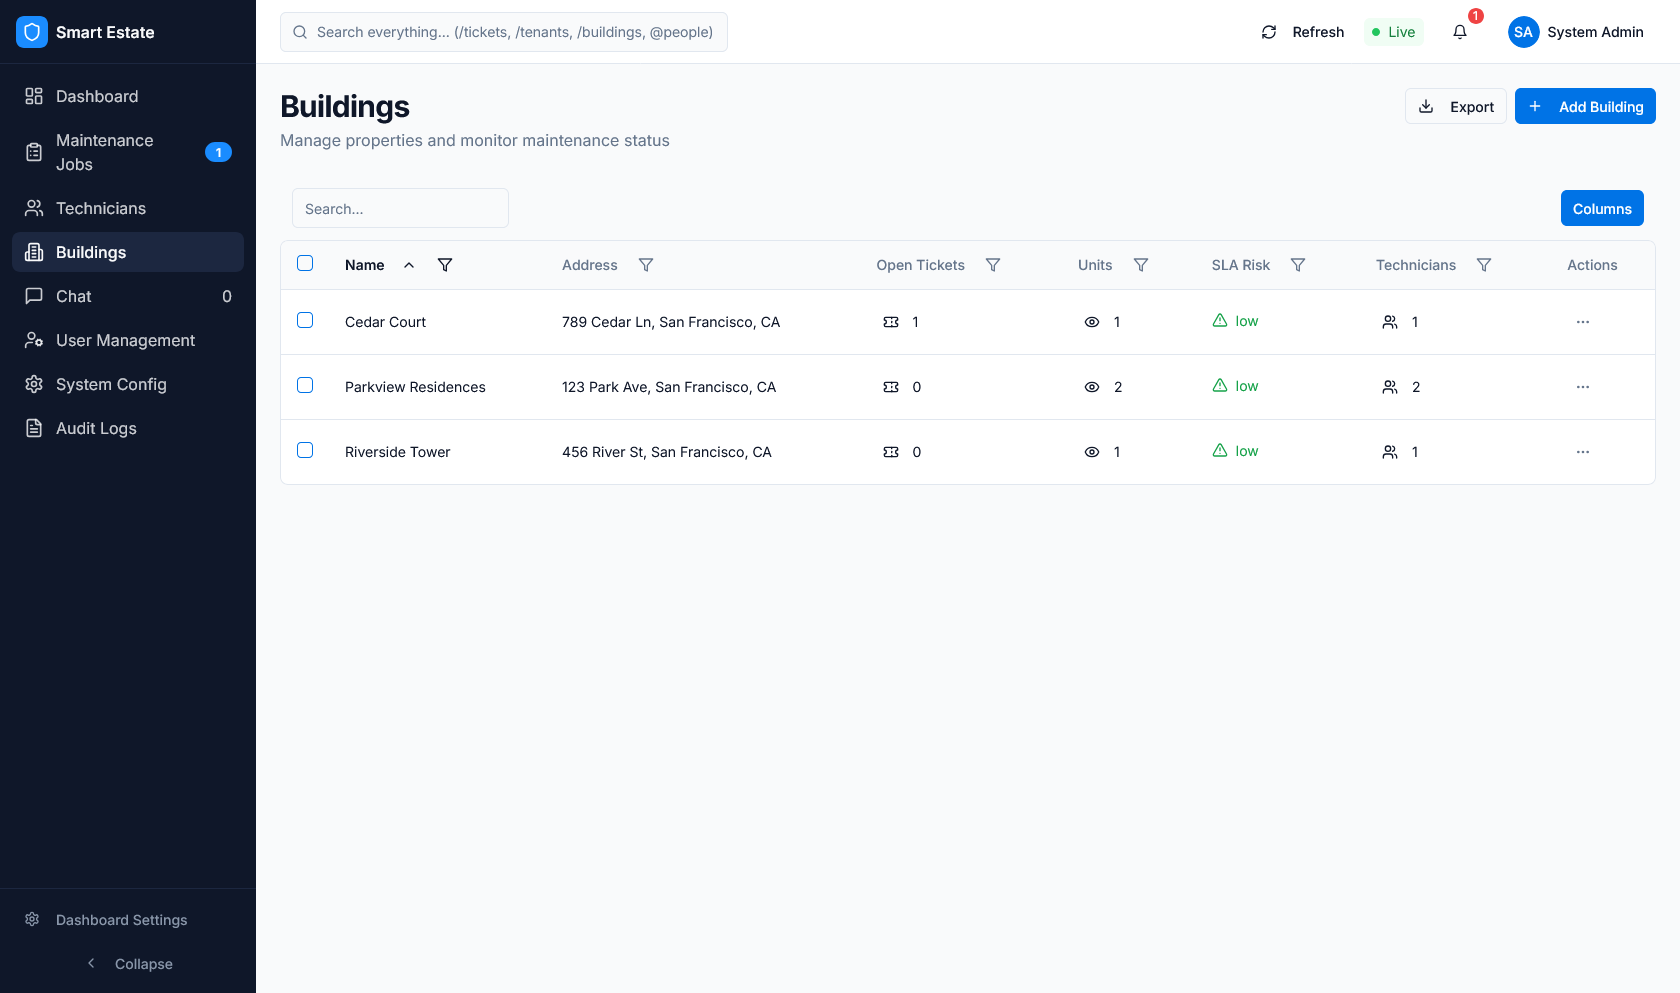 Caption: Buildings view with ticket and SLA indicators.
- What it does: groups work by property.
- What users can do: inspect building load, create buildings, and manage property context.
- What data is shown: building name, unit counts, active tickets, and status markers.
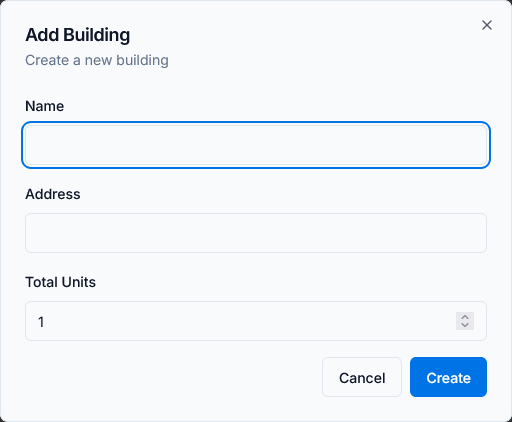 Caption: Building creation form for new property records.
Users
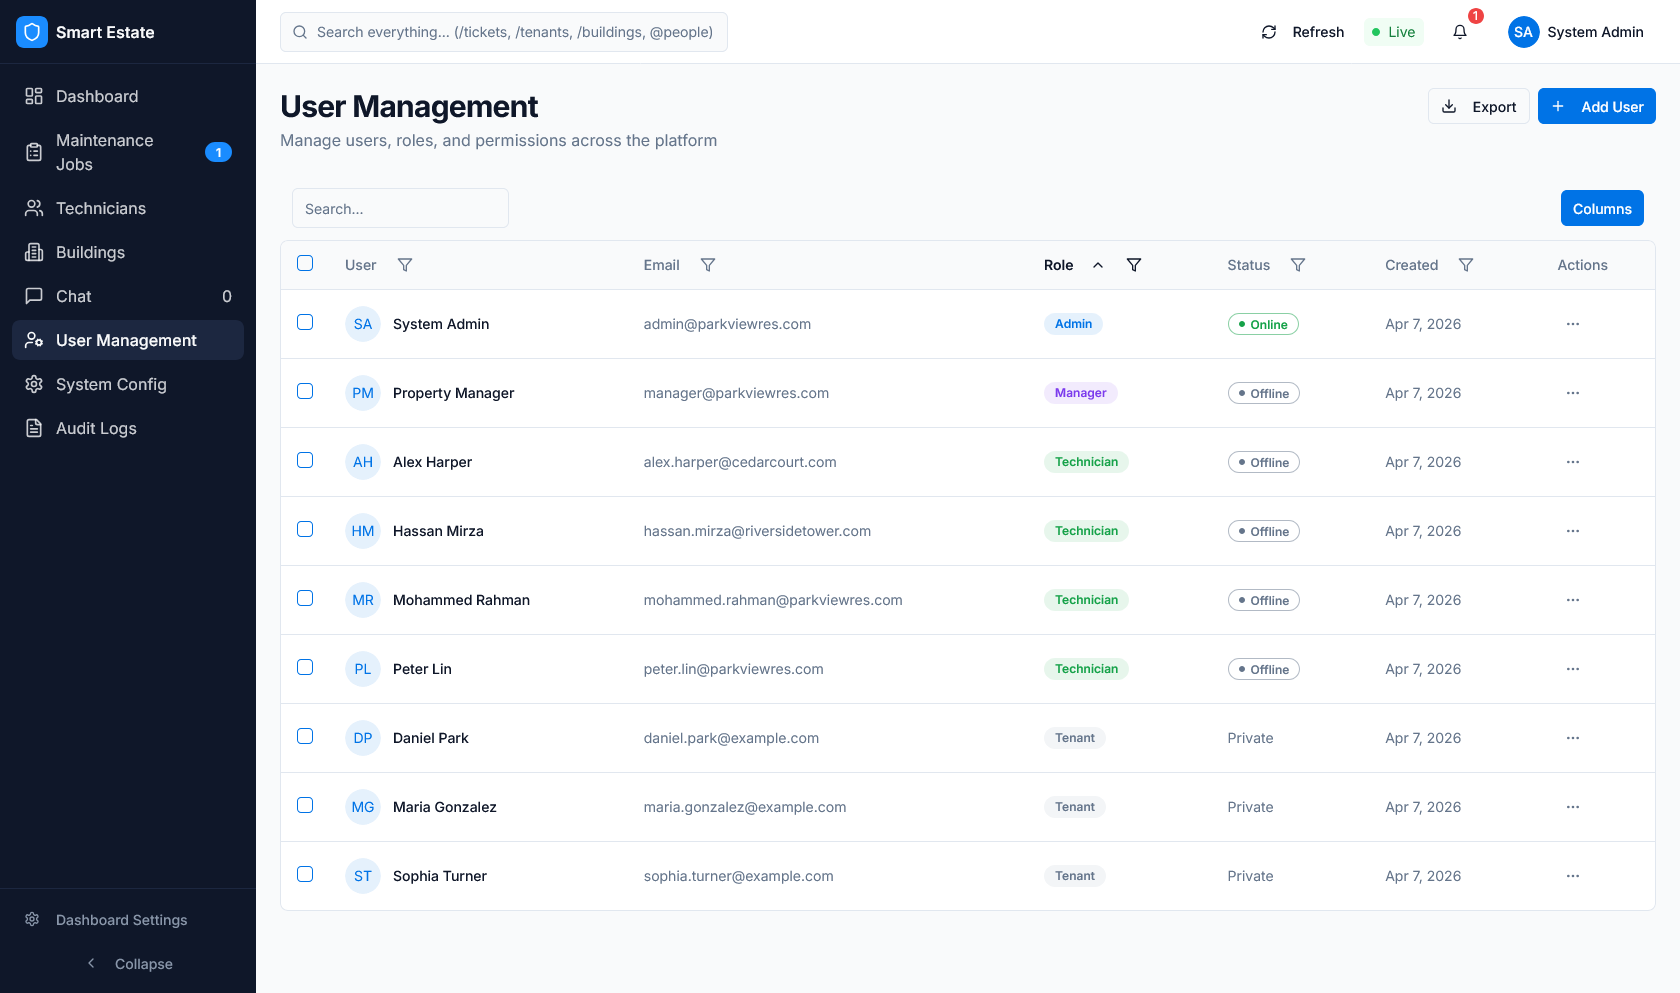 Caption: User directory with roles and account status.
- What it does: manages access across tenant, technician, manager, operations, and admin roles.
- What users can do: review accounts and maintain role coverage.
- What data is shown: names, emails, roles, statuses, and building scope.
Chat
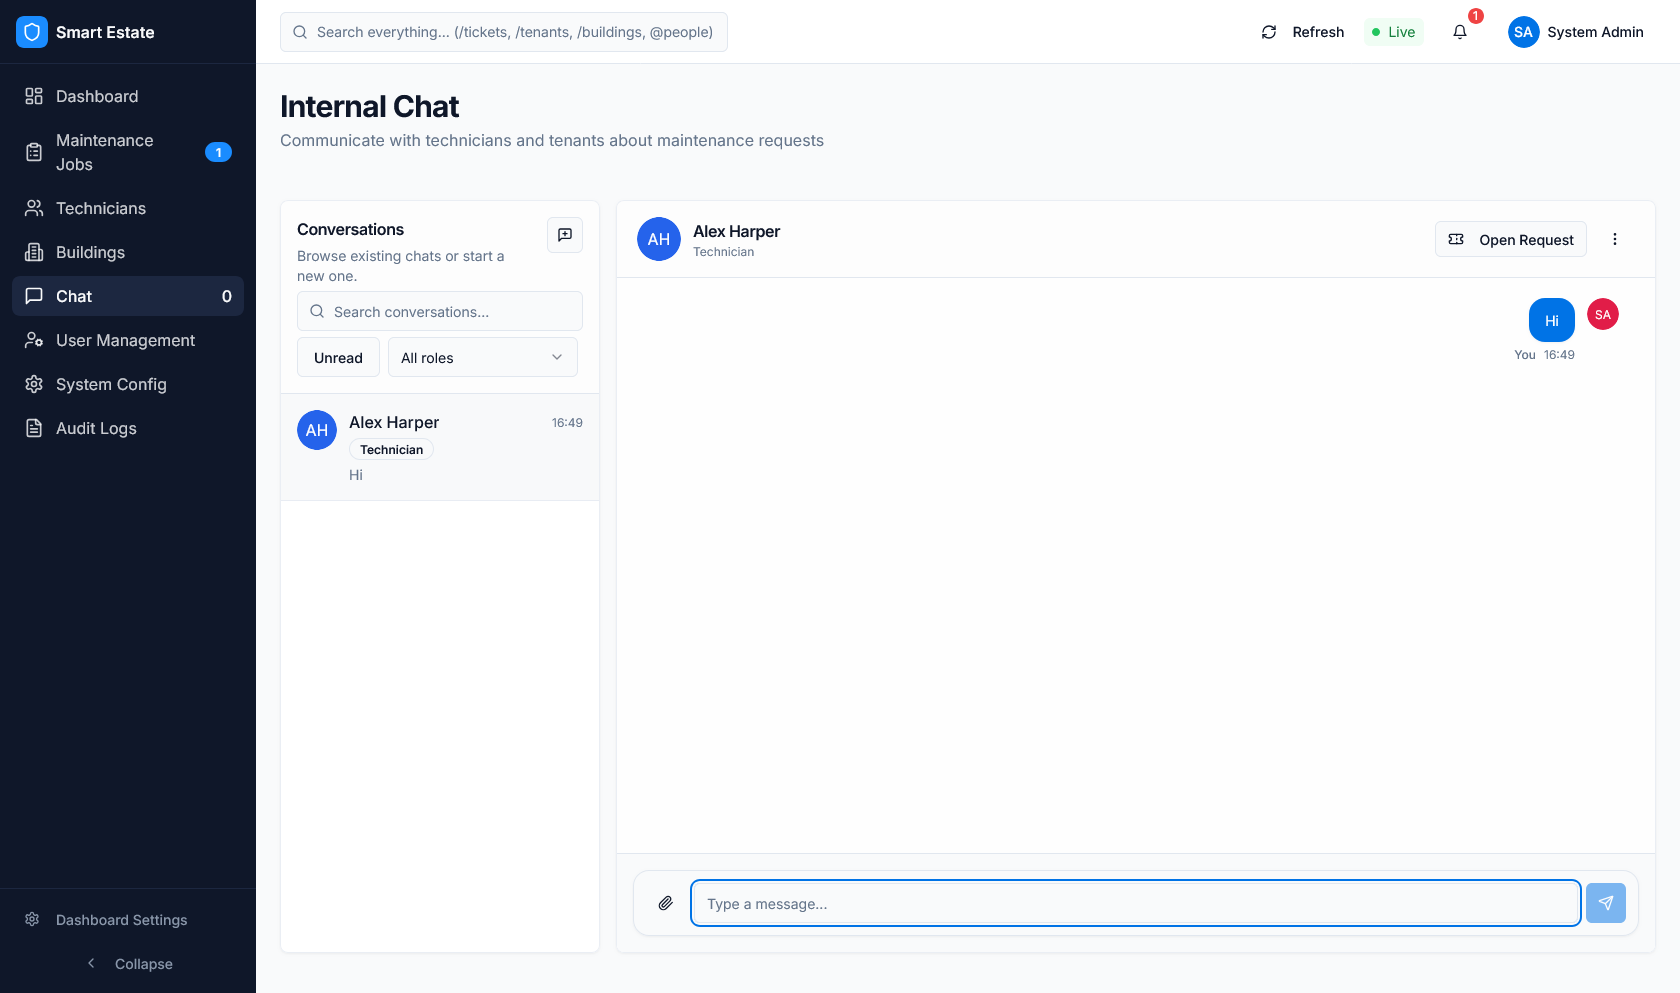 Caption: Ticket-linked chat workspace for operational communication.
- What it does: keeps ticket communication in one place.
- What users can do: exchange updates with technicians and stakeholders.
- What data is shown: message history, sender details, and ticket context.
Settings
SLA
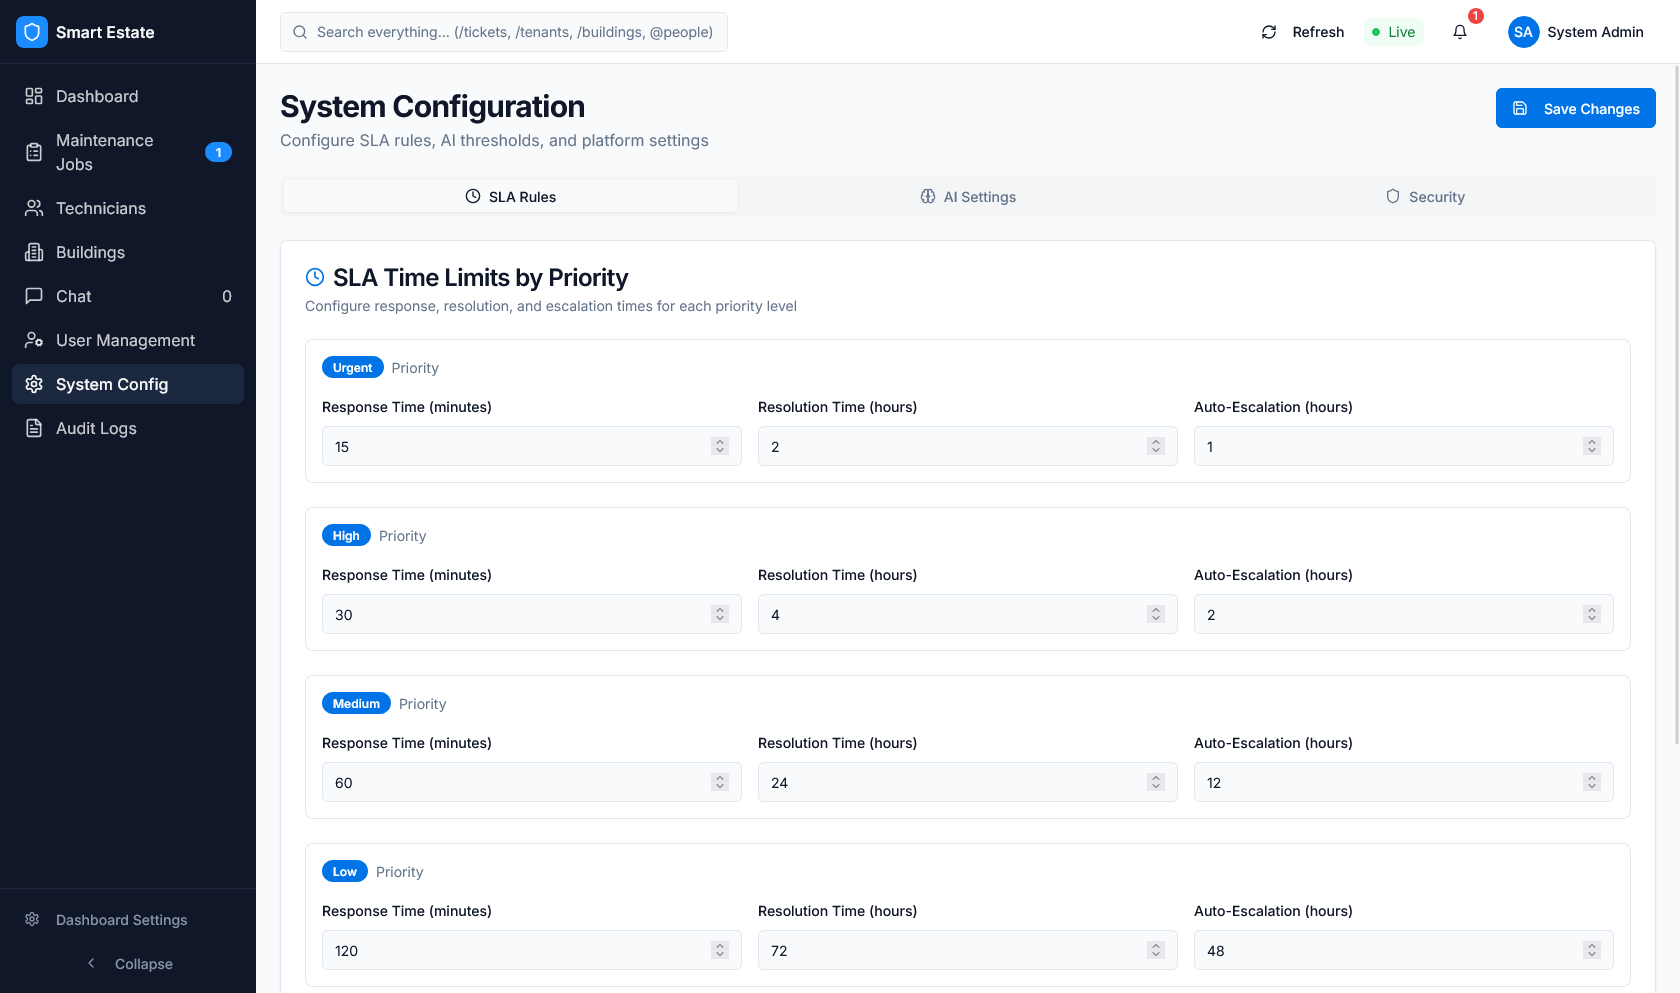 Caption: SLA rules by priority in System Configuration.
- What it does: controls ticket deadlines and escalation timing.
- What users can do: adjust response, resolution, and escalation windows.
- What data is shown: rule values by priority.
AI
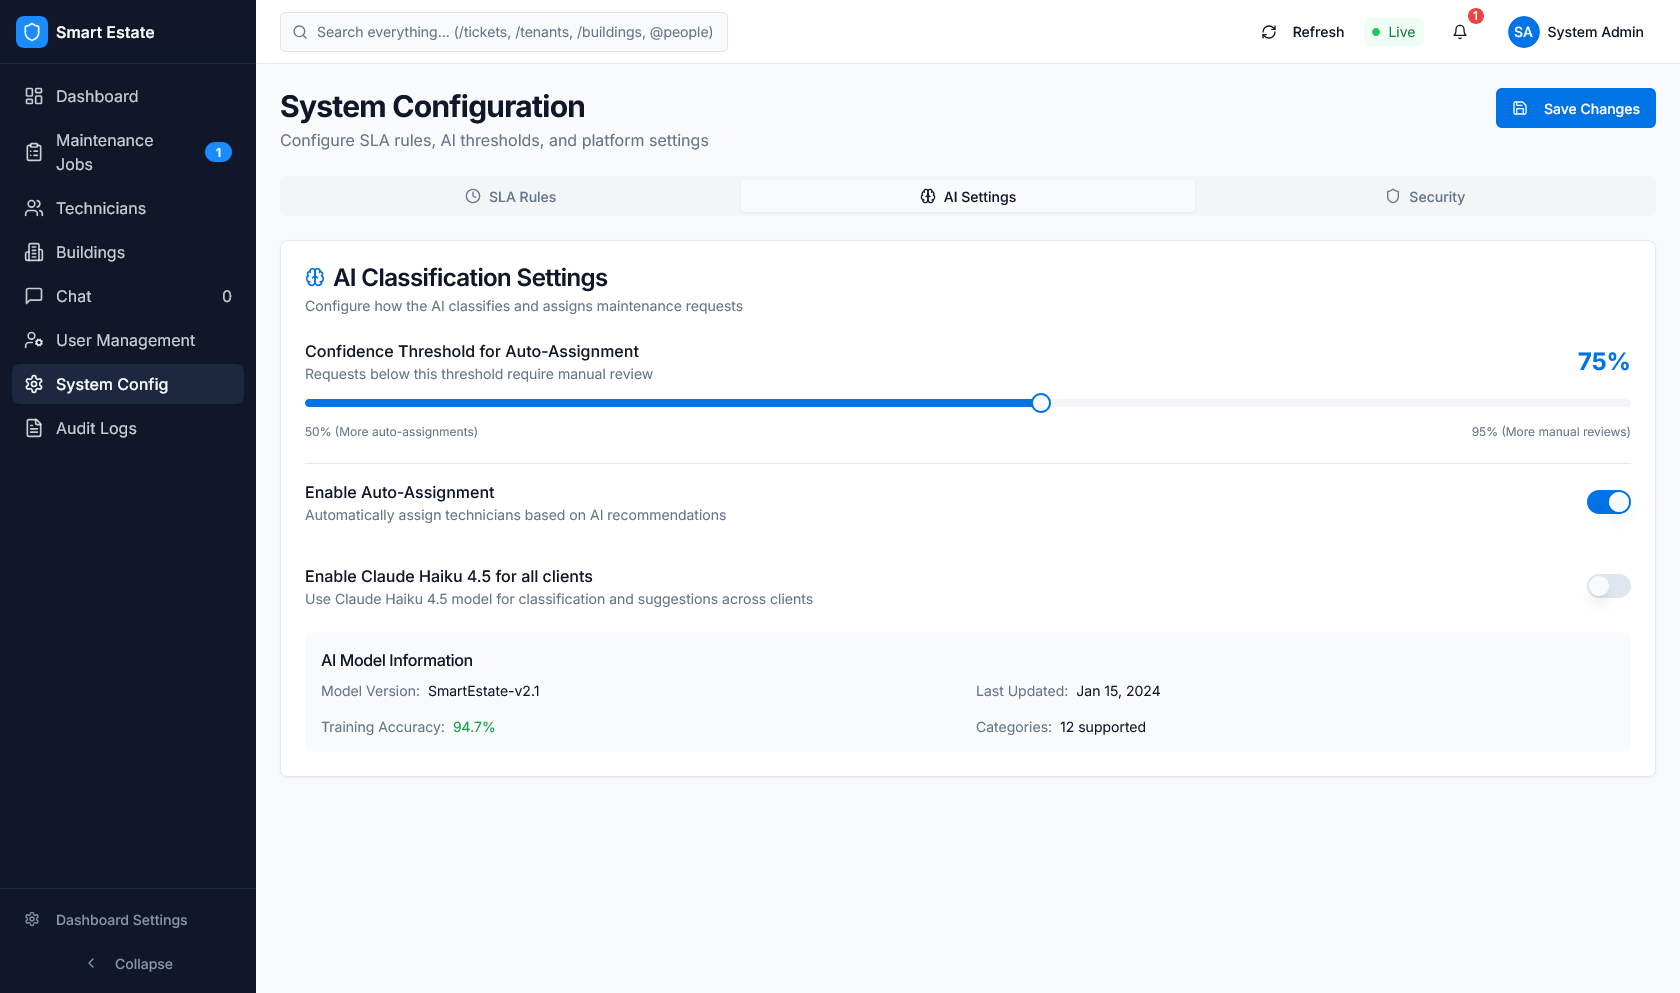 Caption: AI confidence and auto-assignment controls.
- What it does: configures AI intake behavior.
- What users can do: set confidence thresholds and auto-assignment options.
- What data is shown: model metadata and runtime toggles.
Notifications
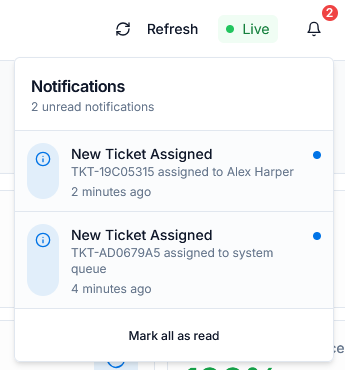 Caption: In-app notifications with unread state.
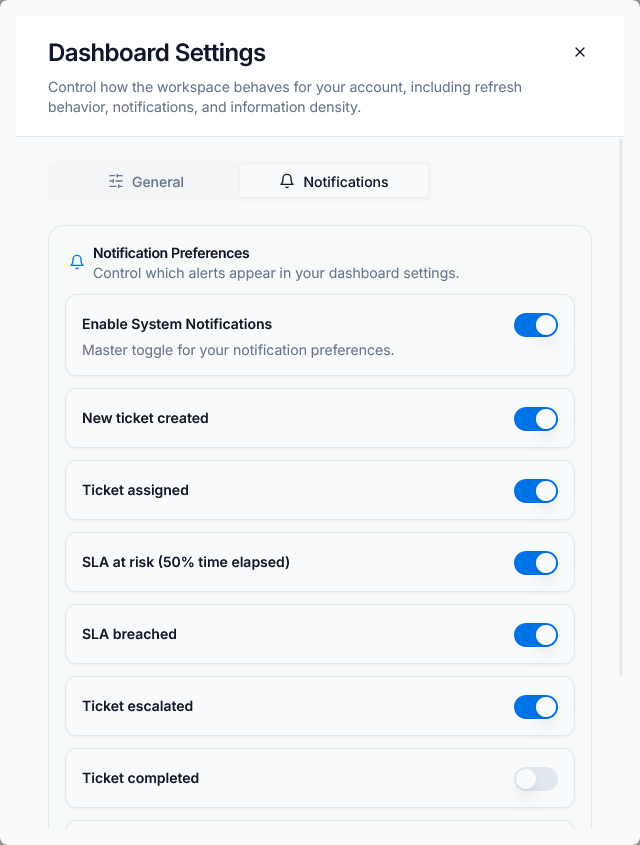 Caption: Notification preferences for ticket and SLA events.
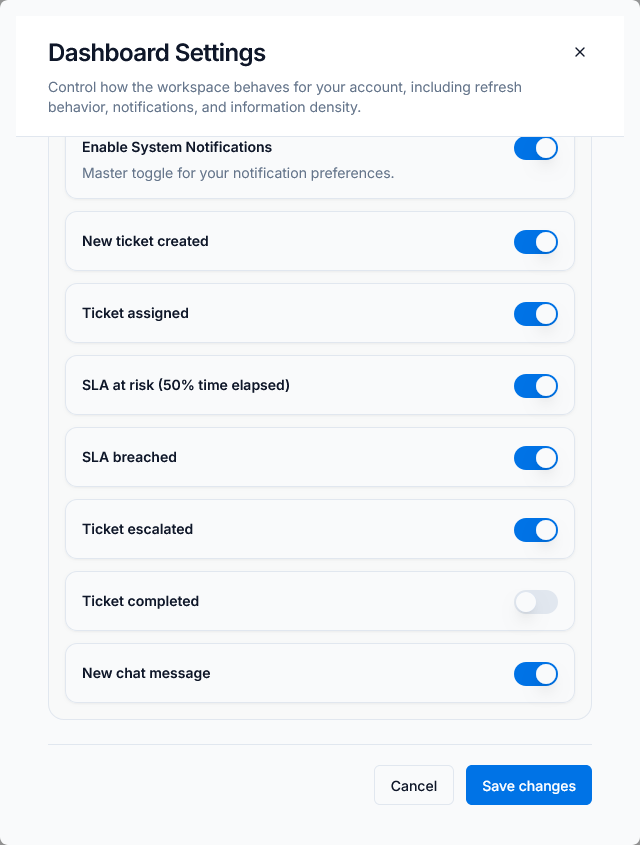 Caption: Full event list for alert routing.
- What it does: controls which events trigger alerts.
- What users can do: turn notifications on or off per event type.
- What data is shown: new tickets, SLA risk, breach, escalation, completion, and chat events.
Security
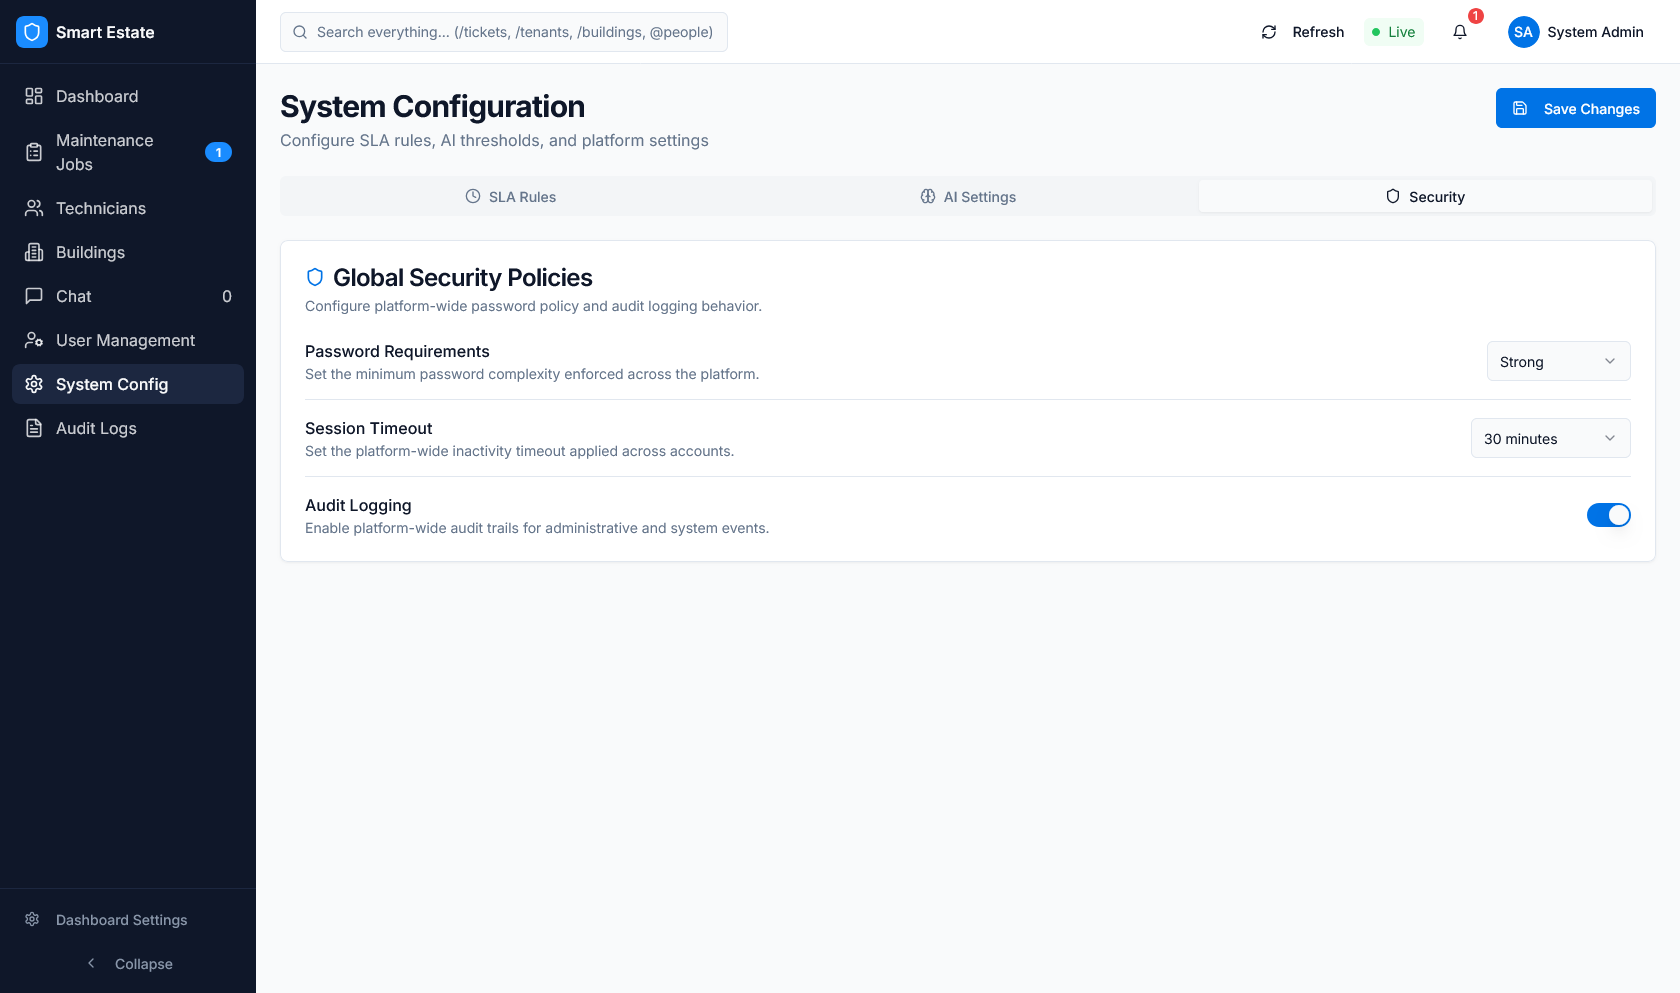 Caption: Security settings for passwords, sessions, and audit logging.
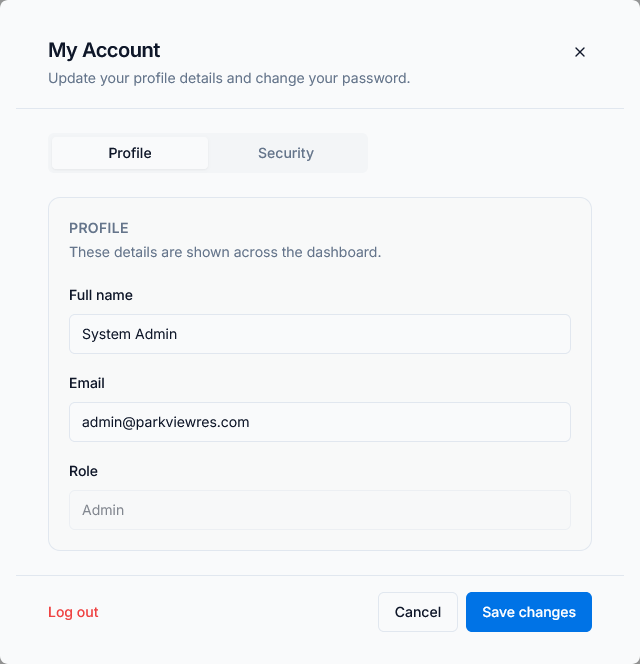 Caption: Account profile editing modal.
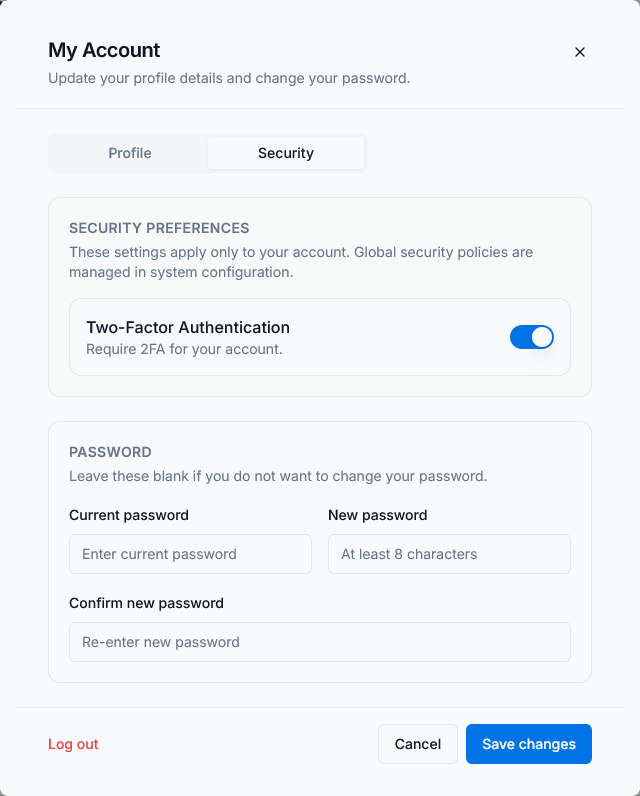 Caption: Password and security preferences.
- What it does: protects account access and session behavior.
- What users can do: update profile details, adjust password, and review security options.
- What data is shown: profile data, password policy, timeout, and audit settings.
Common Flows
Creating a ticket
- Open Tickets / Jobs.
- Create a ticket manually or let chat create it.
- Review the new row in the jobs table.
Caption: New ticket row showing SLA, priority, and assignment details.
Monitoring SLA
- Open the jobs table or SLA settings.
- Check status, due times, and escalation level.
- Watch the dashboard update as the ticket ages.
Caption: SLA settings that control timing and escalation behavior.
Viewing metrics
- Open the dashboard landing page.
- Read KPI cards and charts.
- Use the values to confirm workload and compliance.
Caption: KPI cards and charts used to monitor ticket volume and SLA health.
AI interaction
- Submit a request through chat or upload media.
- Review the predicted category and confidence.
- Use feedback settings if the result needs correction.
Caption: AI controls that shape classification, confidence, and auto-assignment.